top of page
Modelling COVID-19 in India


Model Replication
The initial values for the S, I and R population can be seen on the right. The population was scaled down by a factor of 5 during the computation. We were able to replicate the graph presented in the article using Matlab code. We used the ode45 function and the parameters outlined in the article to achieve the replication.


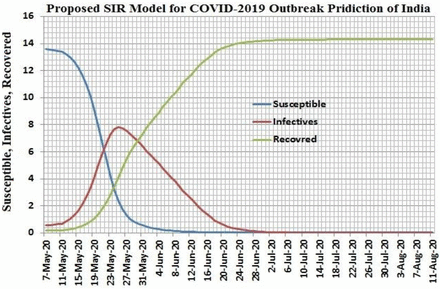
Original Graph from paper
Replicated Graph
bottom of page